Why Heatmaps Aren't Just for Web Pages Anymore

The term "heatmap" used to mean one thing: a color-coded visual of where users clicked on a website. It was simple, effective, and — let's be honest — pretty flat. In the age of 3D environments, though, that flatness no longer tells the full story.
Heatmaps have evolved, and they're stepping into the third dimension.
From Clicks to Coordinates
Traditional web heatmaps are designed for a 2D experience — clicks, scrolls, hovers. But in a virtual world, users don't just click. They walk, turn, pause, glance, interact, and sometimes get lost. That means there's a whole new set of behaviors to track — and a new kind of heatmap to visualize them.
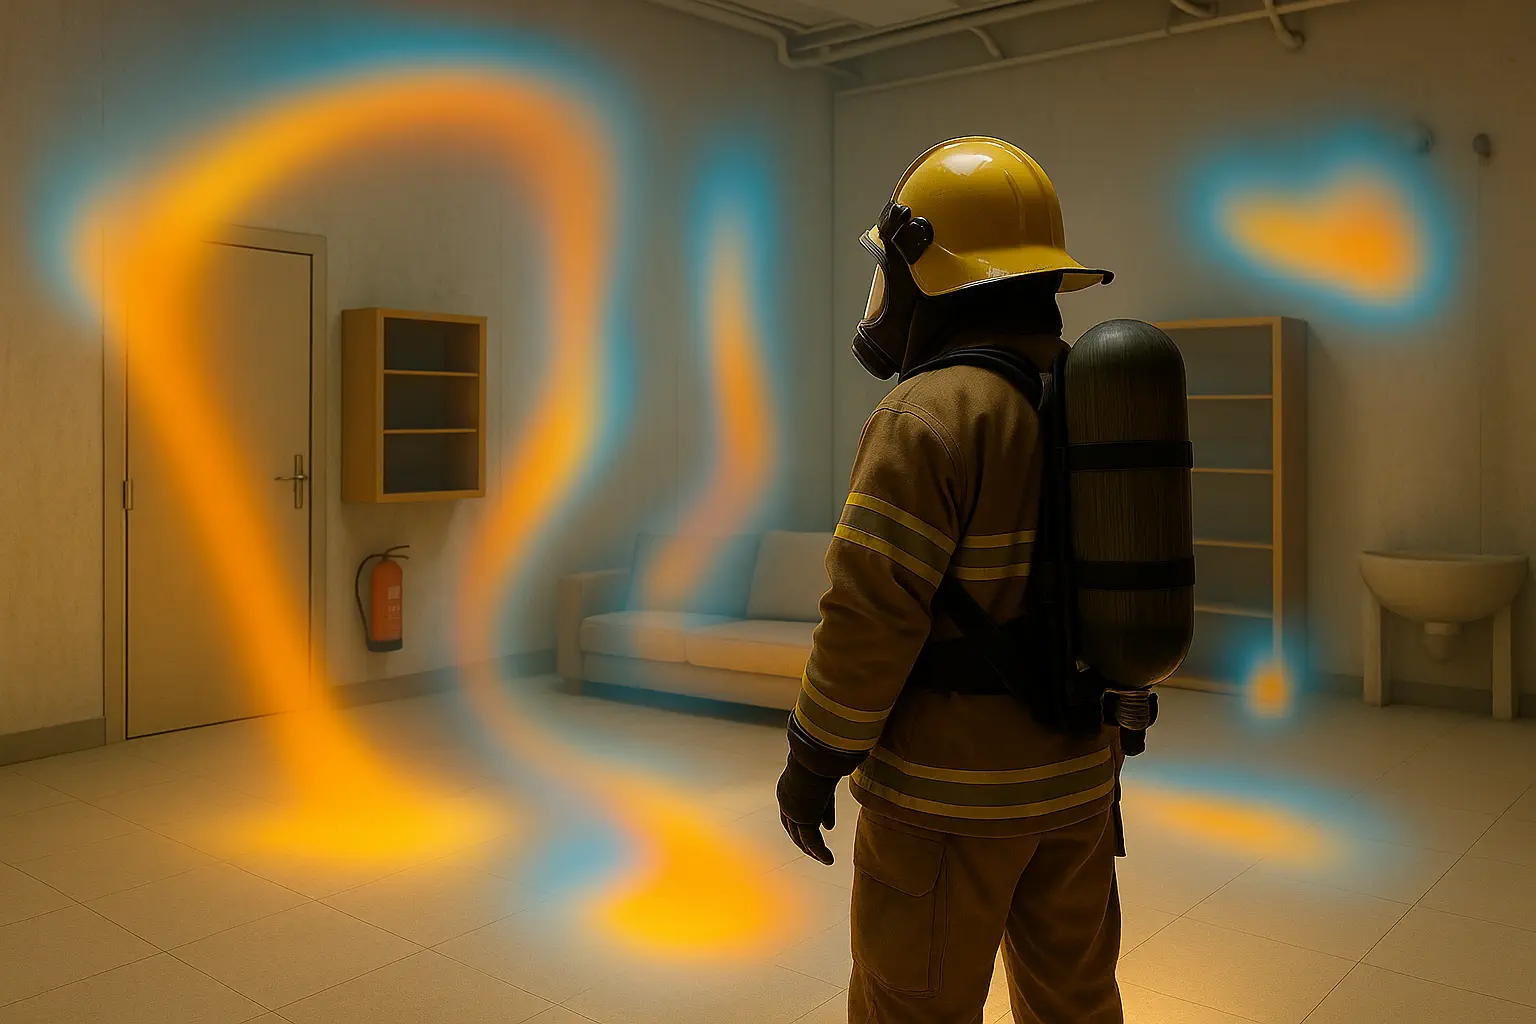
Instead of showing where someone clicked on a landing page, a 3D heatmap might show where users lingered in a virtual showroom, which corridors in a digital twin factory are most trafficked, or what areas of a training simulation were completely ignored.
These maps are made up of XYZ spatial data over time, creating volumetric "hot zones" that tell designers not just what users interacted with, but how they moved through the space.
The Power of Movement
Why does this matter? Because movement is behavior. And behavior is insight.
Let's say you've built a VR onboarding experience. Users are supposed to explore three rooms in a specific order. With 3D heatmaps, you can see if people are skipping Room 2, getting stuck near the entrance, or spending all their time inspecting one interactive object.
That's not just data — it's a blueprint for improvement.
Use Cases: Where 3D Heatmaps Make a Difference
Virtual Retail Spaces
Understand which displays catch attention and which paths lead to conversions. Rearranging virtual shelves based on heatmap data can literally boost ROI.
Architecture & Real Estate
Evaluate how people explore virtual walkthroughs of buildings. Are users even entering that bonus room? Is the open floor plan working the way it should?

Simulated Training Environments
Measure which areas trainees gravitate toward or ignore. In critical training scenarios (like emergency response), heatmaps show where hesitation happens — and that could save lives.

Event and Exhibit Design
In virtual expos or museums, 3D heatmaps can help organizers refine layout, accessibility, and engagement zones.

Behind the Scenes: How It Works
3D heatmaps are built from real-time positional and behavioral data. Here's a quick snapshot:
- Position tracking: Using spatial coordinates (X, Y, Z) to map movement.
- Orientation and gaze: Understanding not just where users are, but where they're looking.
- Dwell time: Highlighting how long users remain in a specific location.
- Interaction points: Capturing object engagements, such as clicks, grabs, or menu triggers.
This data gets crunched and layered into a visual heatmap — often overlaid directly onto the 3D model itself. Think of it as behavioral X-ray vision.
Design That Learns from Users
The magic of heatmaps has always been their ability to surface user intent without asking for it. But in 3D, they do something more profound: they reveal user experience in space.
At Mattertraffic, we're building tools that let designers, developers, and strategists harness these insights at scale. Whether it's fine-tuning the flow of a training simulation or optimizing how customers explore a virtual car showroom, the goal is the same — design smarter by understanding what users actually do.
Because in the 3D world, movement isn't just motion. It's meaning.
Read on Medium:
https://medium.com/mattertraffic/lets-be-honest-the-metaverse-is-starting-to-sound-like-tivo-28c6a201663d